Network Visualization
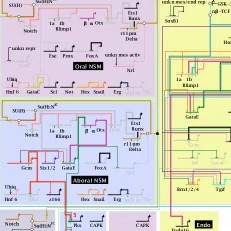
Both of the network visualization tools below, BioFabric and BioTapestry, have been developed by our lab member Bill Longabaugh.


Publications
Longabaugh, W.J.R. Combing the hairball with BioFabric: a new approach for visualization of large networks. BMC Bioinformatics, 13:275, 2012.
Paquette, S.M., Leinonen, K., Longabaugh, W.J.R. BioTapestry now provides a web application and improved drawing and layout tools F1000Research 5:39, 2016.
Longabaugh, W.J.R. BioTapestry: A Tool to Visualize the Dynamic Properties of Gene Regulatory Networks. Methods Mol Biol. 786, 359-94, 2012.
Longabaugh, W.J.R., Davidson, E.H., Bolouri, H. Visualization, documentation, analysis, and communication of large-scale gene regulatory networks. Biochim. Biophys. Acta, 1789(4), 363-74, 2009.
Longabaugh, W., Bolouri, H. Understanding the Dynamic Behavior of Genetic Regulatory Networks by Functional Decomposition. Current Genomics, Vol. 7, No. 6, 333-341, 2006.
Longabaugh, W.J.R., Davidson, E.H., Bolouri, H. Computational representation of developmental genetic regulatory networks. Dev. Biol. 283, 1-16, 2005.